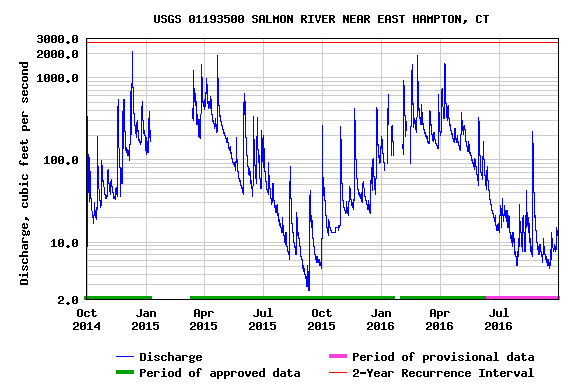
If you are not familiar with the graphic above, you should start studying. Start here: waterdata.usgs.gov
This is the discharge data from the salmon river since Sept. 30th 2014. One thing that is particularly striking about the last two years is just how bad last year's flows were in early fall. The Salmon River, which used to be a substantial river year round, was pushing lest water last September than some of the brook trout streams I fish.
As you can see from the graphic last years drought was bad. This year the water levels dropped much earlier and then stayed low. They aren't as low as 2015, but they are still bad. Here's what the West Branch Farmington looks like for the same time period:
This shows a little more accurately how bad the state of the Farmington has been. For two years in a row it has dropped bellow 70 cfs in the summer and fall. To put that into perspective, the average flow in September and October is around 130 cfs. For even more perspective, here's the last 6 years:
So the least concerning thing about how low the lows are. They were WAY worse in 2007 and 2010. The most concerning thing is how low the highs are. That's why we need big snow years, and super rainy springs. I really don't think it would be all that unlikely that the rivers would come back to health over the next two years... but the low highs could also signify a trend. We'll have to see. Winter will be the biggest teller.


No comments:
Post a Comment